Identify errors with Google Chrome debug console
Google Chrome debug console is a powerful tool that can help us identify the cause of the errors (displayed in red) and speed up finding the solution. We'll be needing your help in performing the steps below so we can better assist you.
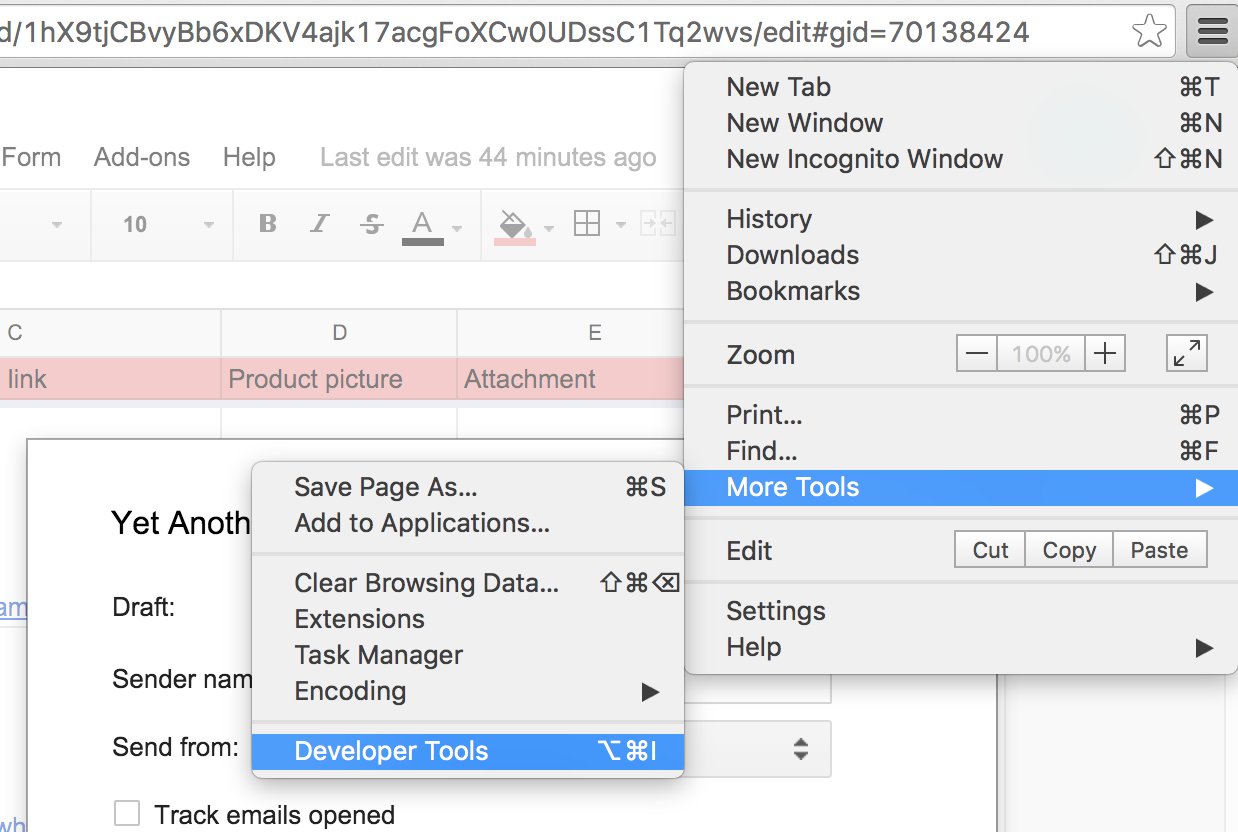
Select Chrome Menu > More Tools > Developer Tools (or right-click > Inspect).
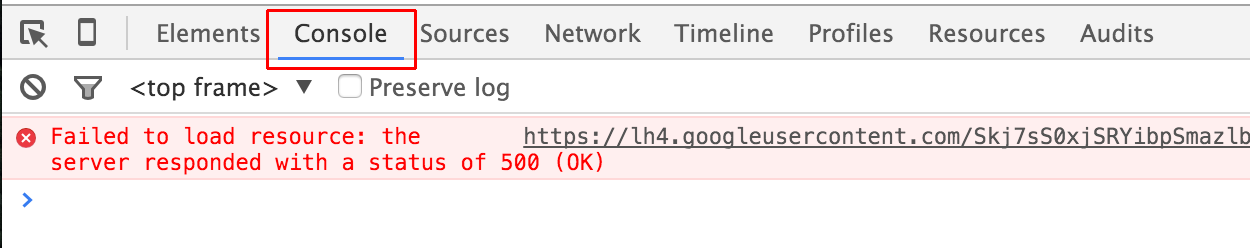
Open the Console tab.
tip
You can also open your console by pressing Ctrl+Shift+J (Windows / Linux) or Cmd+Opt+J (Mac).