Identify errors with Safari debug console
Safari debug console is a powerful tool that can help us identify the cause of the errors (displayed in red) and speed up finding the solution. We'll be needing your help in performing the steps below so we can better assist you.
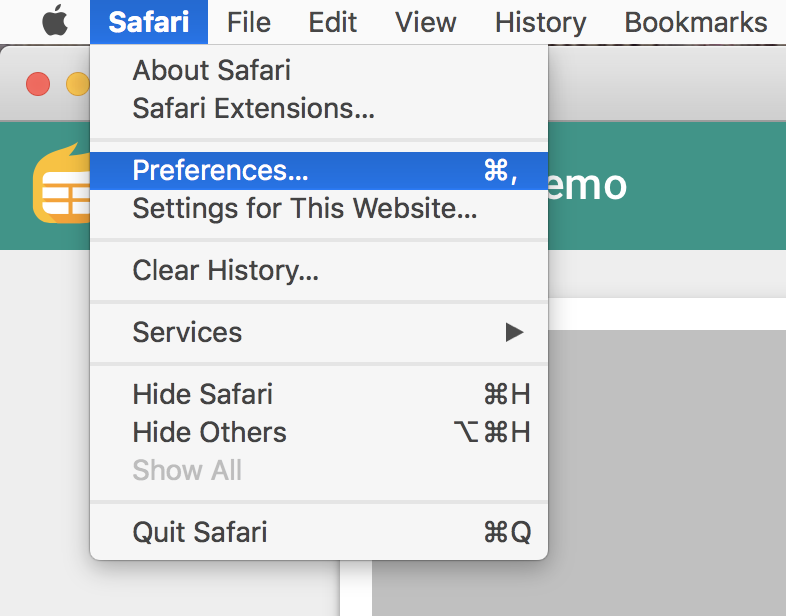
Allow the Develop menu in the menu bar before accessing the console:
Open the Safari menu and select Preferences.
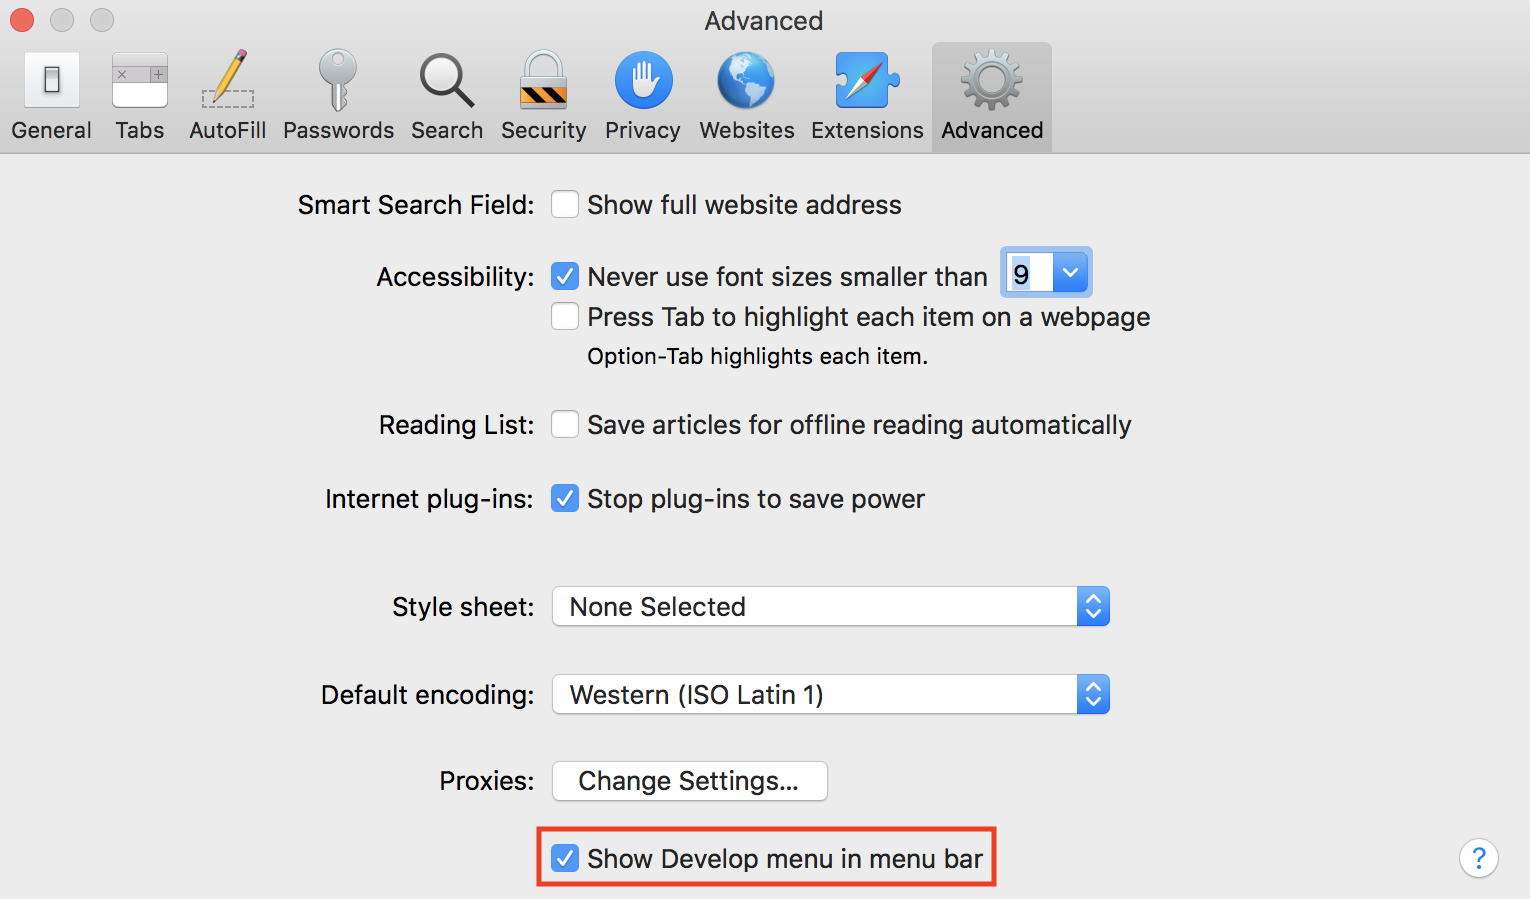
Select the option Show develop menu in menu bar.
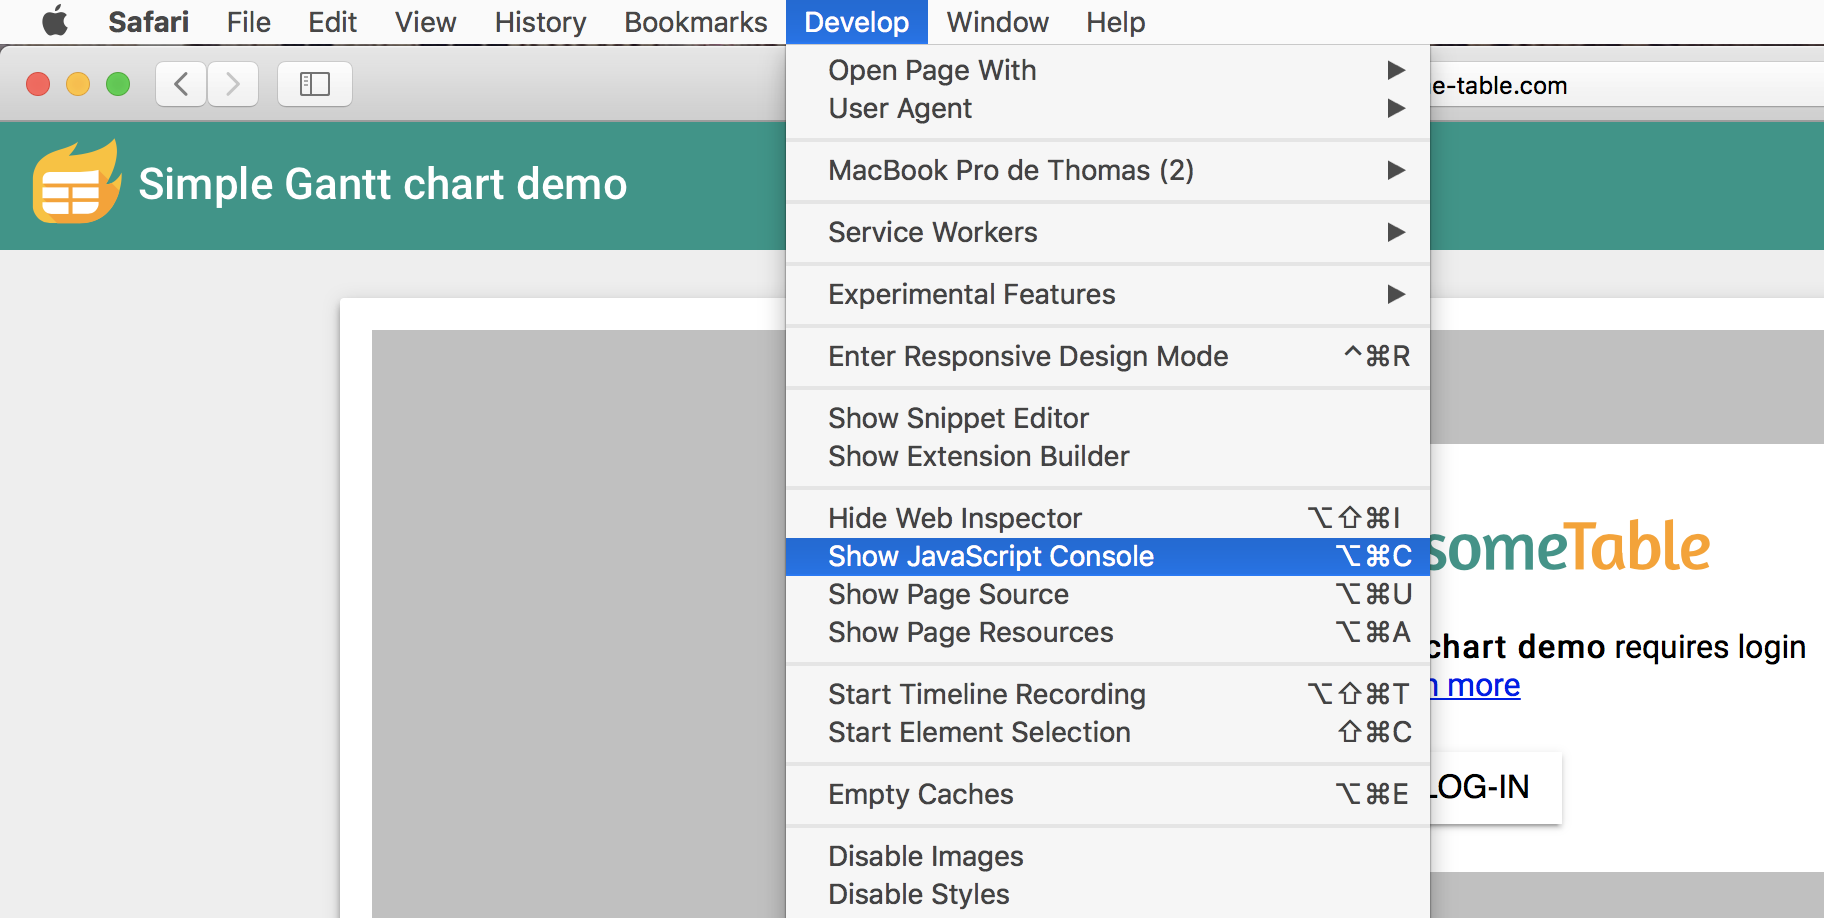
Select Develop > Show JavaScript Console (or right-click > Inspect Element).
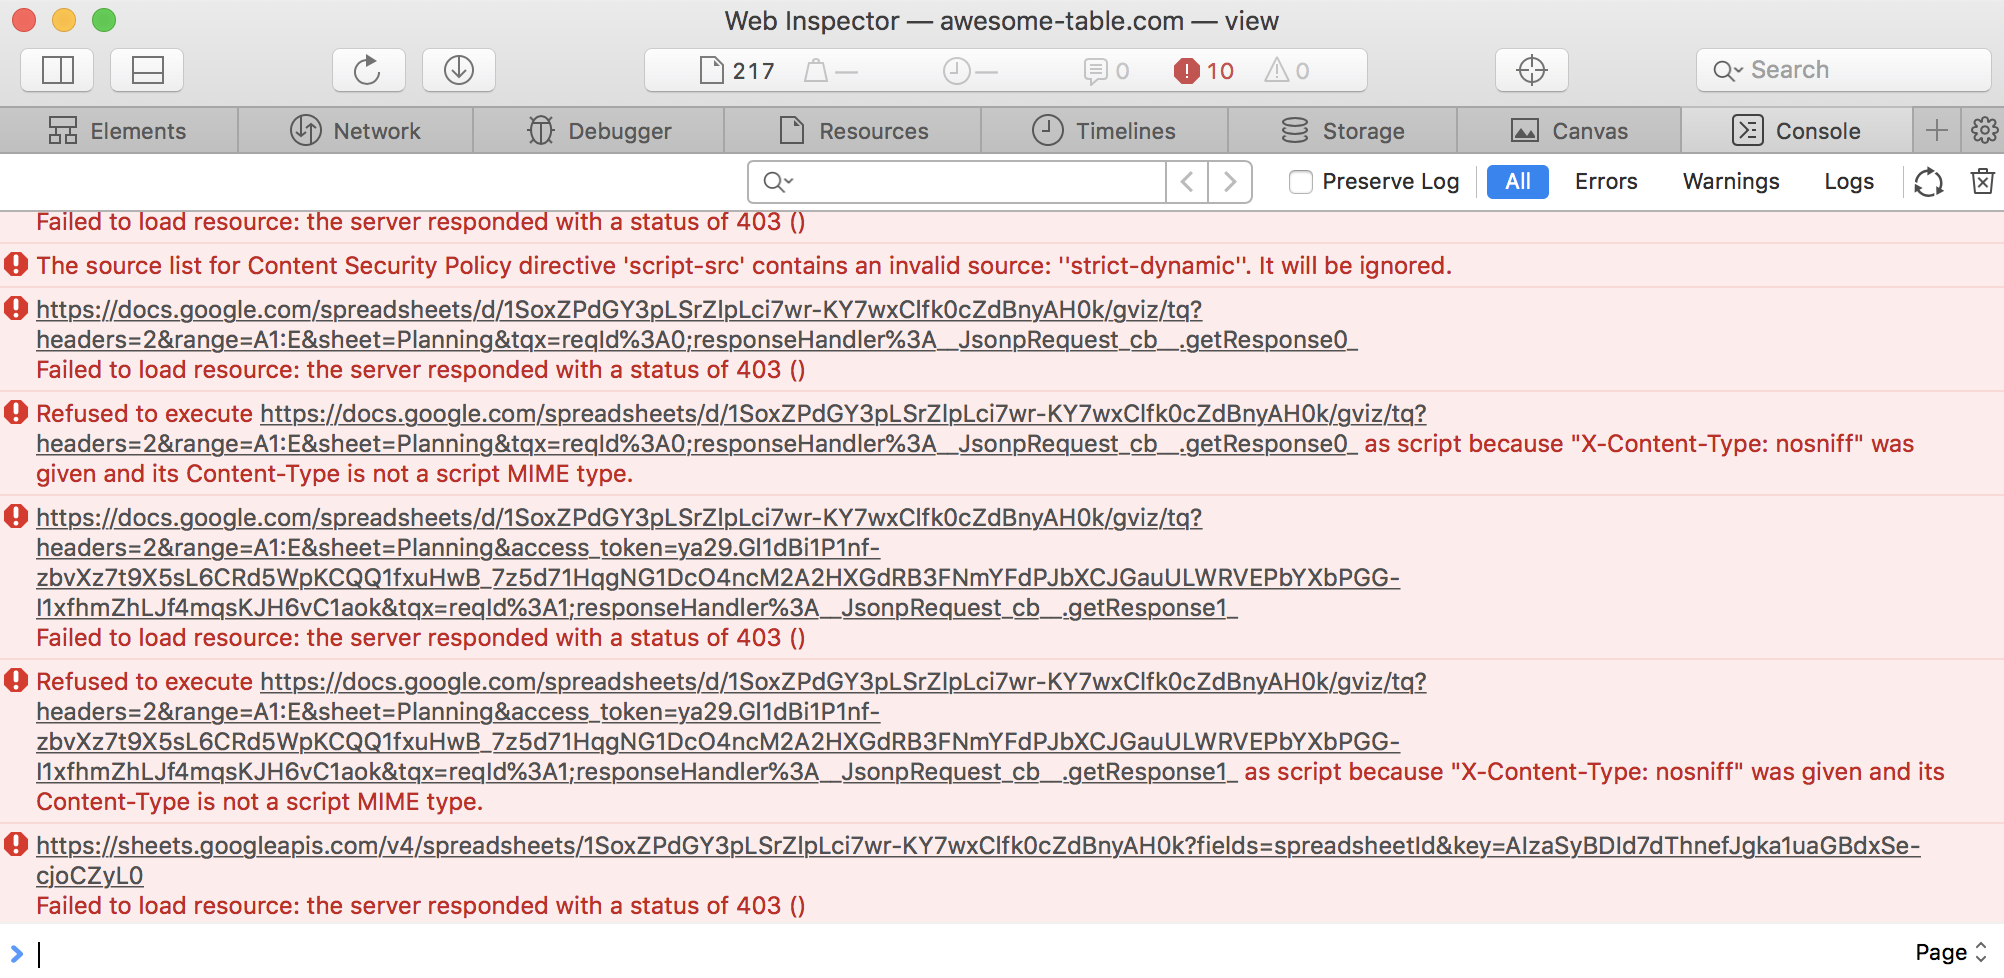
Open the Console tab.
 tip
tipYou can also open your console by pressing
Opt+Cmd+C.